Home › Dynamic Viscosity › Conversion Chart Dynamic Viscosity Conversion Chart
Printable dynamic viscosity conversion tables for the most-used conversions. Values are exact or rounded to 6 significant
figures. Free to print and share with the credit line “Scientific Converters (scientificconverters.com)”.
Print or save as PDF Download PNG chart Open the Dynamic Viscosity Converter
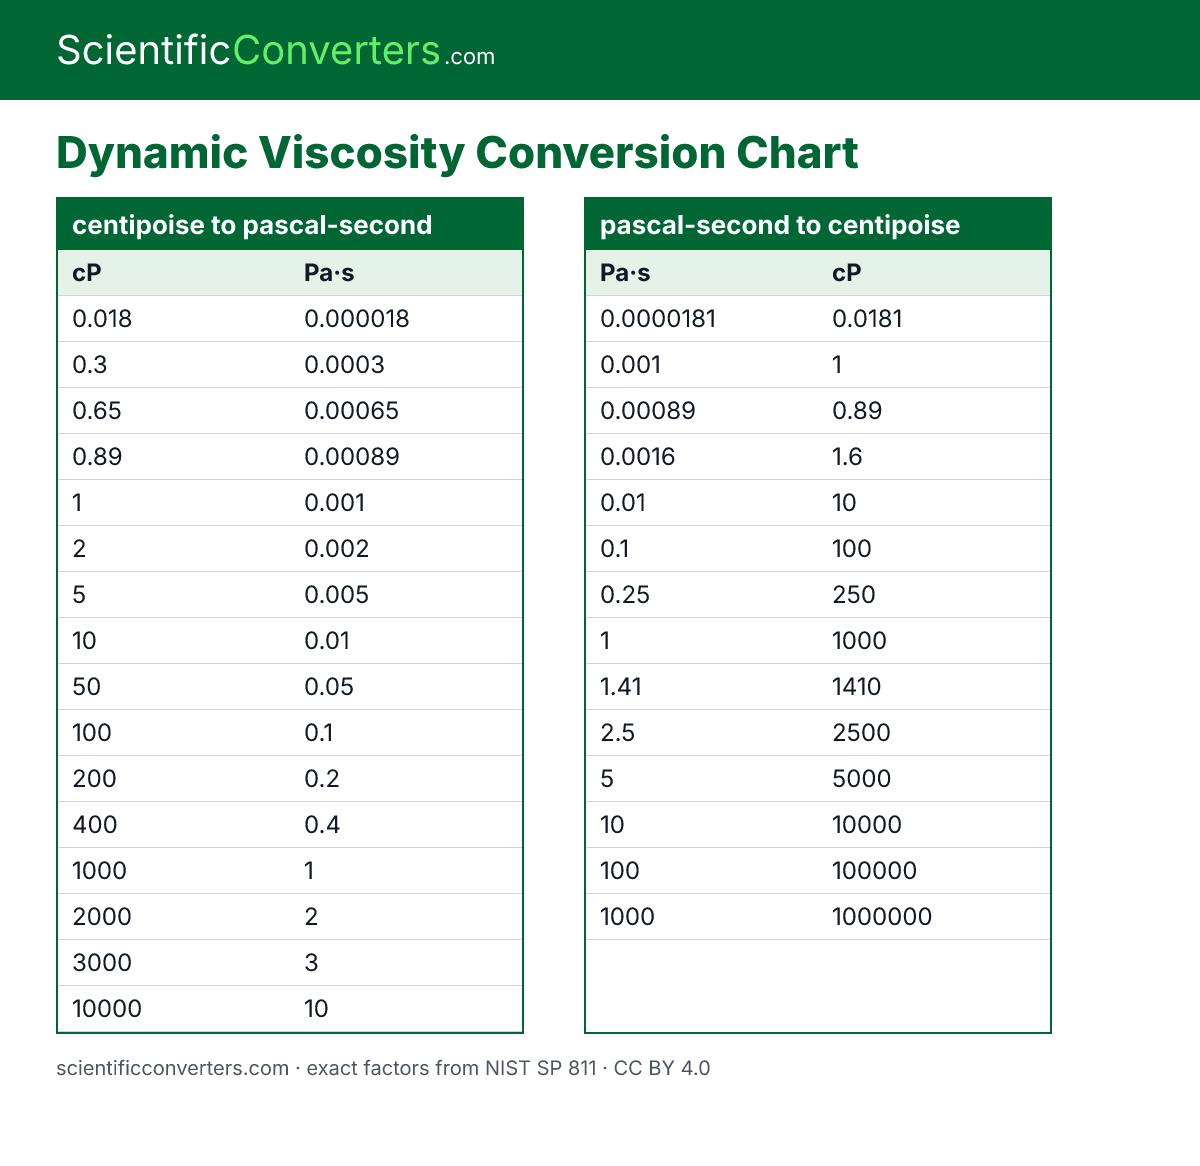
centipoise to pascal-second conversion chart cP Pa·s 0.018 0.000018 0.3 0.0003 0.65 0.00065 0.89 0.00089 1 0.001 2 0.002 5 0.005 10 0.01 50 0.05 100 0.1 200 0.2 400 0.4 1000 1 2000 2 3000 3 10000 10
pascal-second to centipoise conversion chart Pa·s cP 0.0000181 0.0181 0.001 1 0.00089 0.89 0.0016 1.6 0.01 10 0.1 100 0.25 250 1 1000 1.41 1410 2.5 2500 5 5000 10 10000 100 100000 1000 1000000
centipoise to millipascal-second conversion chart cP mPa·s 0.018 0.018 0.3 0.3 0.65 0.65 0.89 0.89 1 1 2 2 5 5 10 10 50 50 100 100 200 200 400 400 1000 1000 2000 2000 3000 3000 10000 10000
centipoise to poise conversion chart cP P 0.018 0.00018 0.3 0.003 0.65 0.0065 0.89 0.0089 1 0.01 2 0.02 5 0.05 10 0.1 50 0.5 100 1 200 2 400 4 1000 10 2000 20 3000 30 10000 100
pascal-second to pound-force second per square foot conversion chart Pa·s lbf·s/ft² 0.0000181 3.78026 × 10⁻⁷ 0.001 0.0000208854 0.00089 0.000018588 0.0016 0.0000334167 0.01 0.000208854 0.1 0.00208854 0.25 0.00522136 1 0.0208854 1.41 0.0294485 2.5 0.0522136 5 0.104427 10 0.208854 100 2.08854 1000 20.8854
millipascal-second to centipoise conversion chart mPa·s cP 0.018 0.018 0.3 0.3 0.65 0.65 0.89 0.89 1 1 1.0 1 1.5 1.5 3 3 10 10 50 50 100 100 250 250 500 500 1000 1000 5000 5000
Source: Scientific Converters (scientificconverters.com), data version 2026-10-15. Factors from NIST SP 811 and the BIPM SI Brochure. Licence:
CC BY 4.0.