Scientific Converters Precise unit conversions for science & engineering.

    Loading…

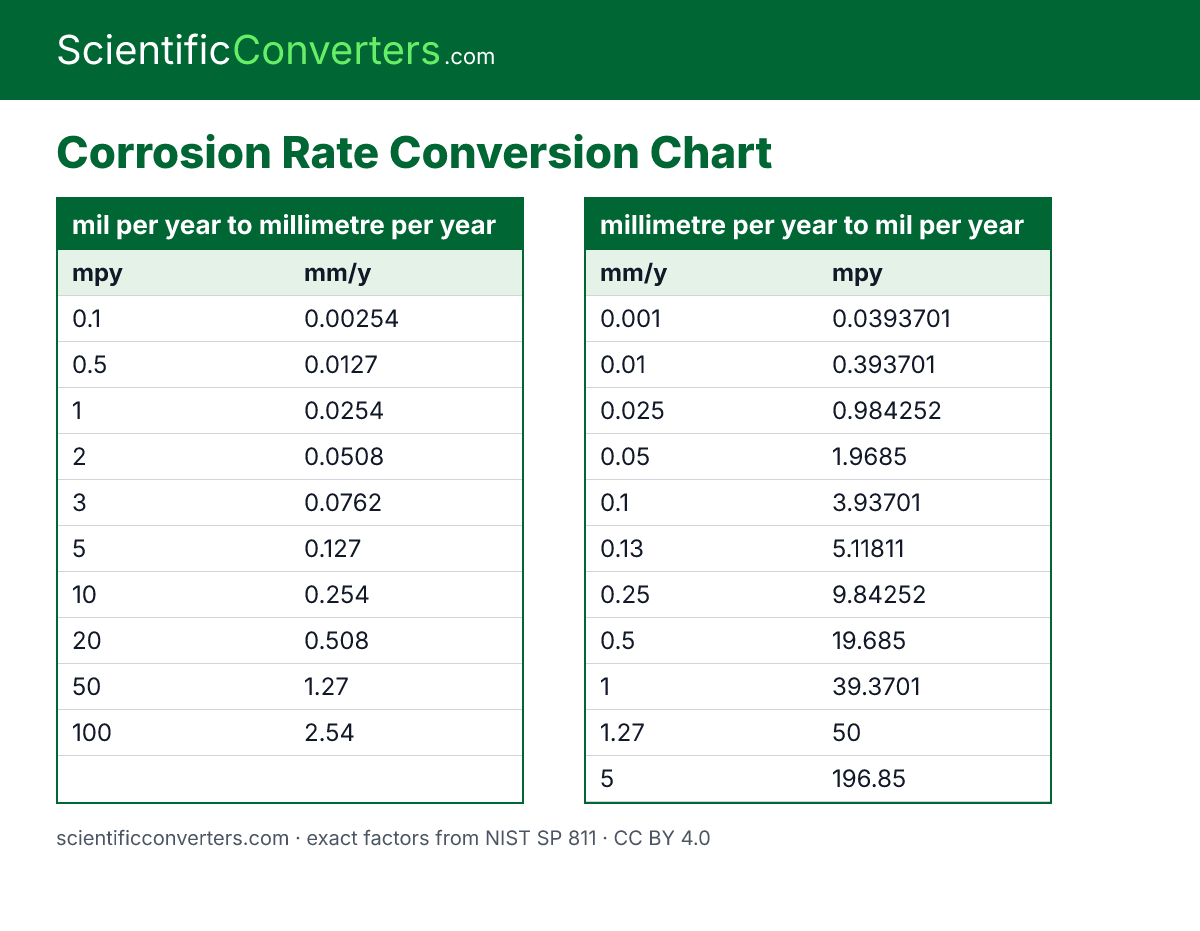
    Corrosion Rate Conversion Chart

    Printable corrosion rate conversion tables for the most-used conversions. Values are exact or rounded to 6 significant figures. Free to print and share with the credit line “Scientific Converters (scientificconverters.com)”.

    Download PNG chart Open the Corrosion Rate Converter

    mil per year to millimetre per year

    mil per year to millimetre per year conversion chart
    mpy mm/y
    0.1 0.00254
    0.5 0.0127
    1 0.0254
    2 0.0508
    3 0.0762
    5 0.127
    10 0.254
    20 0.508
    50 1.27
    100 2.54

    millimetre per year to mil per year

    millimetre per year to mil per year conversion chart
    mm/y mpy
    0.001 0.0393701
    0.01 0.393701
    0.025 0.984252
    0.05 1.9685
    0.1 3.93701
    0.13 5.11811
    0.25 9.84252
    0.5 19.685
    1 39.3701
    1.27 50
    5 196.85

    mil per year to micrometre per year

    mil per year to micrometre per year conversion chart
    mpy µm/y
    0.1 2.54
    0.5 12.7
    1 25.4
    2 50.8
    3 76.2
    5 127
    10 254
    20 508
    50 1270
    100 2540

    micrometre per year to mil per year

    micrometre per year to mil per year conversion chart
    µm/y mpy
    0.1 0.00393701
    1 0.0393701
    2 0.0787402
    5 0.19685
    10 0.393701
    25 0.984252
    50 1.9685
    80 3.14961
    100 3.93701
    200 7.87402

    Source: Scientific Converters (scientificconverters.com), data version 2026-10-15. Factors from NIST SP 811 and the BIPM SI Brochure. Licence: CC BY 4.0.
    Send feedback

    Found a wrong value, a missing unit or an idea? Tell us. We read every message.

    What is it about?

    We store your message, the page you were on and your email if given. See the privacy policy.