Home › Air Permeance › Conversion Chart Air Permeance Conversion Chart
Printable air permeance conversion tables for the most-used conversions. Values are exact or rounded to 6 significant
figures. Free to print and share with the credit line “Scientific Converters (scientificconverters.com)”.
Print or save as PDF Download PNG chart Open the Gurley to Air Permeance Converter (Bendtsen, Frazier)
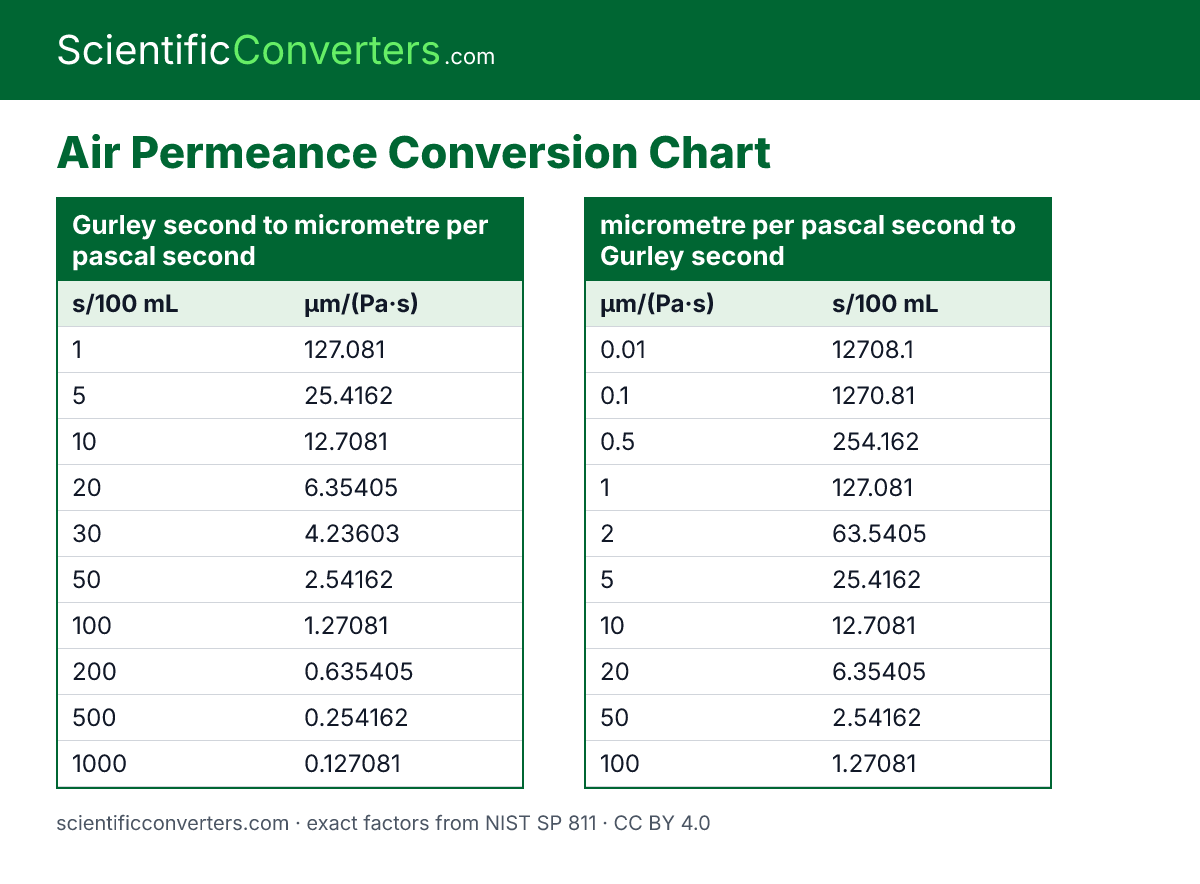
Gurley second to micrometre per pascal second conversion chart s/100 mL µm/(Pa·s) 1 127.081 5 25.4162 10 12.7081 20 6.35405 30 4.23603 50 2.54162 100 1.27081 200 0.635405 500 0.254162 1000 0.127081
micrometre per pascal second to Gurley second conversion chart µm/(Pa·s) s/100 mL 0.01 12708.1 0.1 1270.81 0.5 254.162 1 127.081 2 63.5405 5 25.4162 10 12.7081 20 6.35405 50 2.54162 100 1.27081
Gurley second to Frazier conversion chart s/100 mL cfm/ft² @125 Pa 1 3.12699 5 0.625398 10 0.312699 20 0.15635 30 0.104233 50 0.0625398 100 0.0312699 200 0.015635 500 0.00625398 1000 0.00312699
Frazier to Gurley second conversion chart cfm/ft² @125 Pa s/100 mL 0.5 6.25398 1 3.12699 2 1.5635 5 0.625398 10 0.312699 20 0.15635 50 0.0625398 100 0.0312699 200 0.015635 500 0.00625398
Gurley second to Bendtsen conversion chart s/100 mL mL/min (Bendtsen) 1 11208.5 5 2241.71 10 1120.85 20 560.427 30 373.618 50 224.171 100 112.085 200 56.0427 500 22.4171 1000 11.2085
Bendtsen to Gurley second conversion chart mL/min (Bendtsen) s/100 mL 10 1120.85 50 224.171 100 112.085 200 56.0427 500 22.4171 1000 11.2085 1500 7.47236 2000 5.60427 3000 3.73618 5000 2.24171
Source: Scientific Converters (scientificconverters.com), data version 2026-10-15. Factors from NIST SP 811 and the BIPM SI Brochure. Licence:
CC BY 4.0.