Scientific Converters Precise unit conversions for science & engineering.

    Loading…

    Thermal Resistance (R-value) Conversion Chart

    Printable thermal resistance (r-value) conversion tables for the most-used conversions. Values are exact or rounded to 6 significant figures. Free to print and share with the credit line “Scientific Converters (scientificconverters.com)”.

    Download PNG chart Open the R-Value Converter (US R to RSI, m²·K/W)

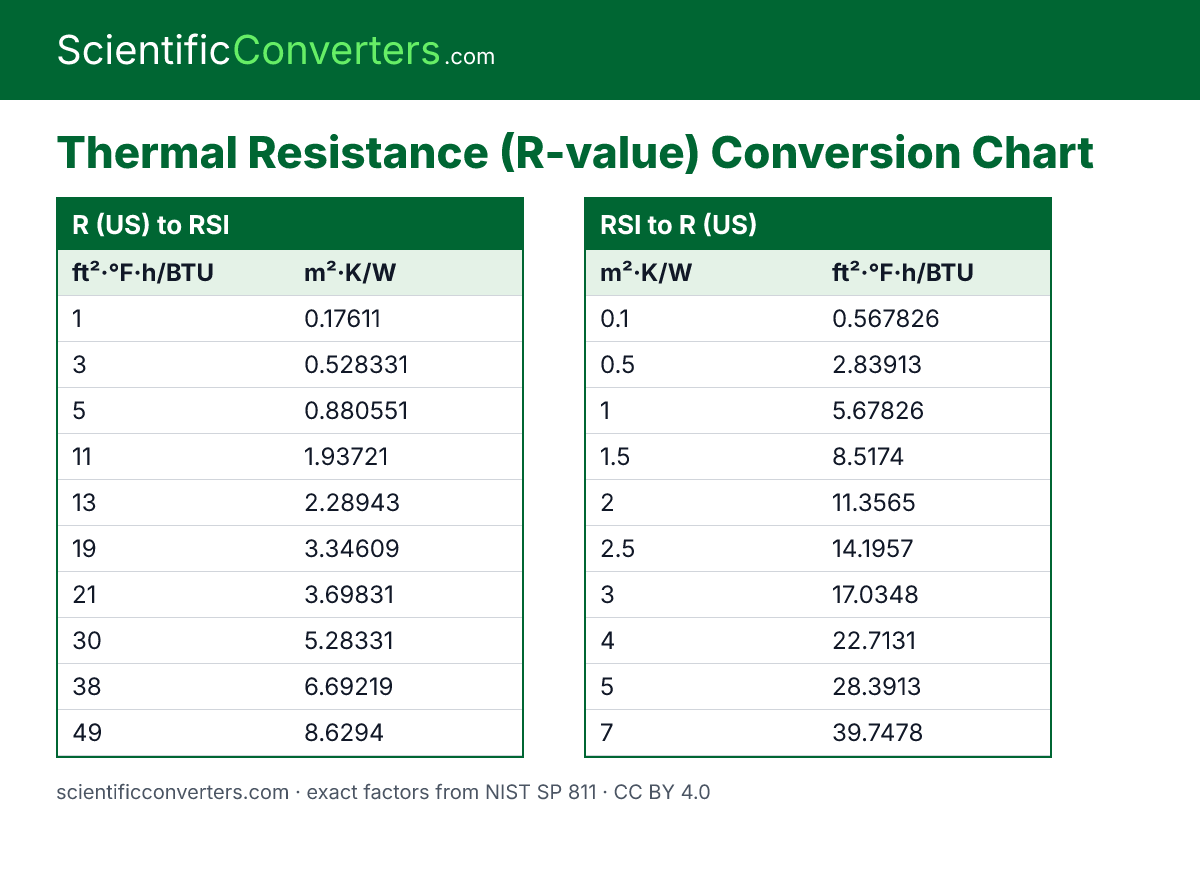
    R (US) to RSI

    R (US) to RSI conversion chart
    ft²·°F·h/BTU m²·K/W
    1 0.17611
    3 0.528331
    5 0.880551
    11 1.93721
    13 2.28943
    19 3.34609
    21 3.69831
    30 5.28331
    38 6.69219
    49 8.6294

    RSI to R (US)

    RSI to R (US) conversion chart
    m²·K/W ft²·°F·h/BTU
    0.1 0.567826
    0.5 2.83913
    1 5.67826
    1.5 8.5174
    2 11.3565
    2.5 14.1957
    3 17.0348
    4 22.7131
    5 28.3913
    7 39.7478

    clo to RSI

    clo to RSI conversion chart
    clo m²·K/W
    0.3 0.0465
    0.5 0.0775
    0.6 0.093
    0.7 0.1085
    1 0.155
    1.2 0.186
    1.5 0.2325
    2 0.31
    3 0.465
    4 0.62

    clo to tog

    clo to tog conversion chart
    clo tog
    0.3 0.465
    0.5 0.775
    0.6 0.93
    0.7 1.085
    1 1.55
    1.2 1.86
    1.5 2.325
    2 3.1
    3 4.65
    4 6.2

    tog to clo

    tog to clo conversion chart
    tog clo
    0.5 0.322581
    1 0.645161
    2.5 1.6129
    4.5 2.90323
    7.5 4.83871
    9 5.80645
    10.5 6.77419
    12 7.74194
    13.5 8.70968
    15 9.67742

    Source: Scientific Converters (scientificconverters.com), data version 2026-10-15. Factors from NIST SP 811 and the BIPM SI Brochure. Licence: CC BY 4.0.
    Send feedback

    Found a wrong value, a missing unit or an idea? Tell us. We read every message.

    What is it about?

    We store your message, the page you were on and your email if given. See the privacy policy.